Stop Counting Dollars.
Start Counting Stops.
Social media assigns arbitrary meaning to single statistics. Win rate versus R:R, endlessly, as if one of them wins the argument. They're not competing. They're one system — stop, target, win rate — and the number that actually decides whether you survive isn't any of them. Move the sliders and watch it appear.
The number on the account. It's the one everybody posts, and it tells you almost nothing about whether you'll still be trading on Friday.
$1,000 daily loss limit, $500 risk per trade. Two trades is not a sample. Two trades is a coin flip.
The stat wars are the wrong argument
"R:R doesn't matter, win rate is everything." "Win rate is meaningless, just take 3:1." You've watched this argument a hundred times. Both sides are wrong, because both sides are treating one number as if it lives alone.
Stop loss, profit target and win rate are a dynamic relationship. Change one and the other two move. And the relationship itself shifts with the regime — a trending market and a balancing market do not hand you the same R:R for the same setup. In a clean directional trend, 1:1 is fine; you can risk off early and move to break-even because the path of least resistance is with you. On a balance day, that same strategy eats failed breakout after failed breakout.
Once you start thinking about the market in terms of stops and ATR, it changes how you view the market.@jackgleason · Cabo Mastermind, March 2022
That line rearranged how I look at an account. Because once your stop is a unit — 1.5 ATR, say, not "$500 because that felt right" — your account stops being an amount of money and becomes a number of attempts.
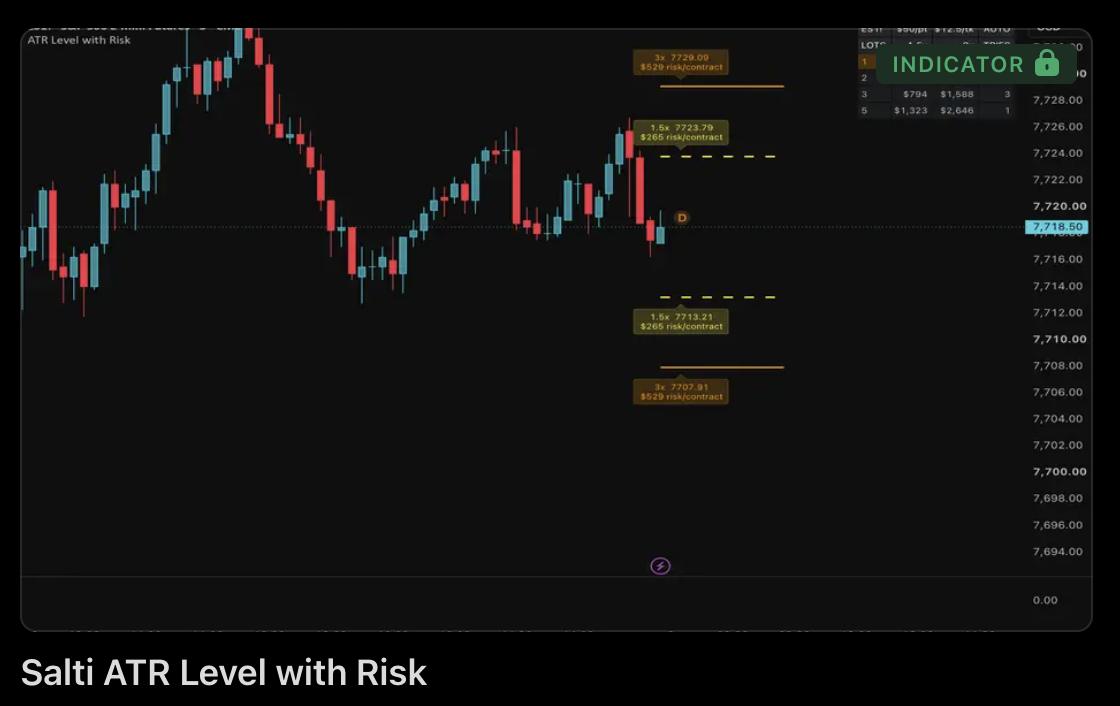
Salti ATR Level with Risk — the study behind every number on this page. Detects your contract automatically, prices each stop in dollars, and shows how many attempts your max loss limit actually buys.
Claim the free indicator →Your bankroll, counted in stops
Here's the part that should genuinely bother you. Below is a trader with a real, measured, profitable edge — a 60% win rate and winners twice the size of losers. Not a fantasy. A good system.
Now watch what stop size alone does to their odds of surviving the day. The edge never changes. Only the number of attempts does.
A 50k eval sits around $2,000 today. Mine was $2,500.
Your stop, in dollars. This is the only thing you're changing.
Backtested, not hoped for.
Keep this above 1. I aim for 2. My last sample ran 4.09.
Each chip is one stop
Two trades is not a sample. Two trades is a coin flip. You can do everything right and still lose both — not because the system failed, but because variance in a two-trade sample is enormous.
With a genuinely profitable system.
Done for the day before the edge shows up.
Shrink the stop to $100 and you have ten attempts instead of two. Same edge. Same trader. The edge suddenly has room to breathe.
This is what people mean — badly — when they call tight risk "scared money." It isn't. Defined risk is a mathematical system that can withstand variance. A trader with good expectancy who oversizes gets stopped out by ordinary variance before their edge ever gets a chance to work. They didn't lose because they had no edge. They lost because they ran out of attempts.
The same thing, on a real eval
That's the abstract version. Here's the sheet I actually keep, rebuilt so you can drive it. A 50k eval, micro contracts, ATR-derived stops — and the only two numbers that decide whether the eval is survivable.
Switch any micro to its full-size contract without touching anything else. Watch what happens to your attempt count.
Top row is micros, bottom row is their full-size contract.
A 1.5× multiple on a 9-period 5m ATR. Reference below.
Scaling up multiplies your risk, not your edge.
Scales with account size. The drawdown is the only capital genuinely at risk.
Consecutive losers it takes to hit the max loss limit.
Trades at 1R that clear the profit target.
50 attempts against 50 winners needed. That is a survivable eval — you get enough tries that a normal losing streak doesn't end the account.
You can't raise your R:R. You can only move your entry.
The other thing the feed sells you: better R:R means same risk, bigger profit. So just move your target further out.
You can't. You cannot arbitrarily increase a profit target and expect price to reach it. My targets are ATR-derived, contextual, mechanical — they do not move just because I'd like a nicer ratio. What actually changes my R:R, almost every time, is where I got in.
Same move. Same target. Same invalidation. Drag the entry.
Target and invalidation are fixed by structure. Only this moves.
The closer you enter to the middle of balance, the worse your R:R gets — and the more likely you are to be the one holding drawdown while somebody who waited is already risked off. You are almost always better off exiting and looking for another entry than you are moving your stop.
And yes: sometimes we're impatient and jump in rather than wait for confirmation. I'm guilty of it. I almost always end up regretting it. I've forward-tested my own execution against blind limits at my levels, and found that if I'd just set the limit and waited, the trade would have ended up better.
If you've felt any of this
None of these mean you're bad at this. Every one of them has a mechanical explanation, and it's almost never the one the feed gives you.
Your A+ setups stopped working and nothing you changed fixed it. Macro shifted. Rates, inflation, risk-on to risk-off. Your strategy didn't break — its regime ended, and nobody taught you there was a regime.
You did everything right and still lost both trades. Two attempts is not a sample. That's not a system failure, that's variance in a sample far too small to say anything.
You keep entering early and regretting it. Impatience is a positioning problem wearing a psychology costume. It shows up in your R:R before it shows up in your P&L.
You've caught yourself moving a stop instead of taking the loss. The trade was already invalidated. Moving the stop doesn't buy time, it buys a bigger loss.
You've thought "maybe this isn't for me after all." Trading will test your sanity, especially early. That thought is common enough to be a rite of passage — but it usually arrives right after a stretch of oversizing, not a stretch of bad reads.
None of the YouTube lambo mentors take the time to explain what actually drives markets to move, so you're left with no framework for what's happening in front of you. It's far easier to teach a few candle patterns than to articulate something as nuanced as auction theory or macro. Which is exactly why the stats that matter — MAE, profit factor, average win versus loss, largest win versus loss, consecutive losers — never show up in a post. Those are the ones you can actually target and improve, and the ones that tell you whether you're cutting winners early, holding losers too long, or
The rest of this is on the Substack.
The full piece works the whole system through — with my real sheets, my real trade stats, and the annotated charts behind §3.
- Sizing your stop off ATR instead of off a round dollar number
- The 50k eval sheet: MLL, profit target, and attempts, side by side
- MAE, profit factor and consecutive losers — reading your own weak points
- Why trend days and balance days need different strategies entirely
- Why more trades, properly sized, is a statistical advantage
SaltStack · Futures trading